-
Bullheaded – Episode 4
•
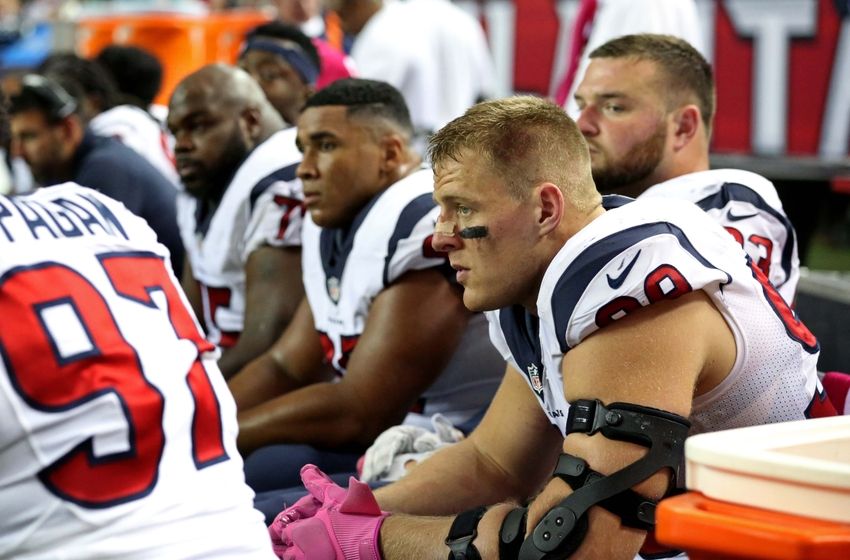
Welcome to episode 4 of Bullheaded, my weekly review of the Houston Texans. After Sunday’s game against the Atlanta Falcons, many wondered if there was any Houston Texans team left to even talk about. The 48-21 left Texans Nation in disbelief and anger. But they had to get over it…
-
Bullheaded – Episode 3
•
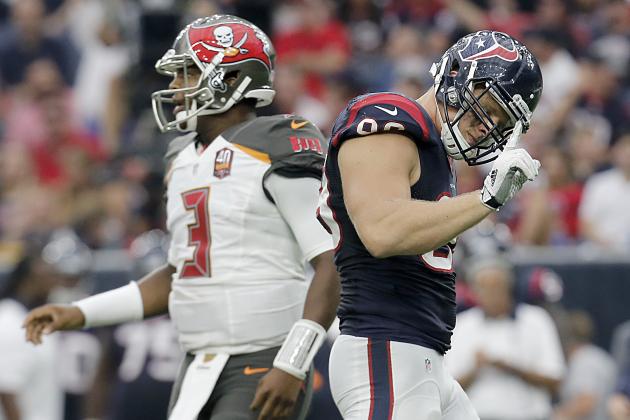
Week 4 of the season has arrived but not before the Texans grabbed their first win of the season by beating the Tampa Bay Buccaneers. While that was a huge relief of the team’s shoulders, the bigger news cam during the week when it was announced running back Arian Foster…
-

Bullheaded – Epsiode 2
•
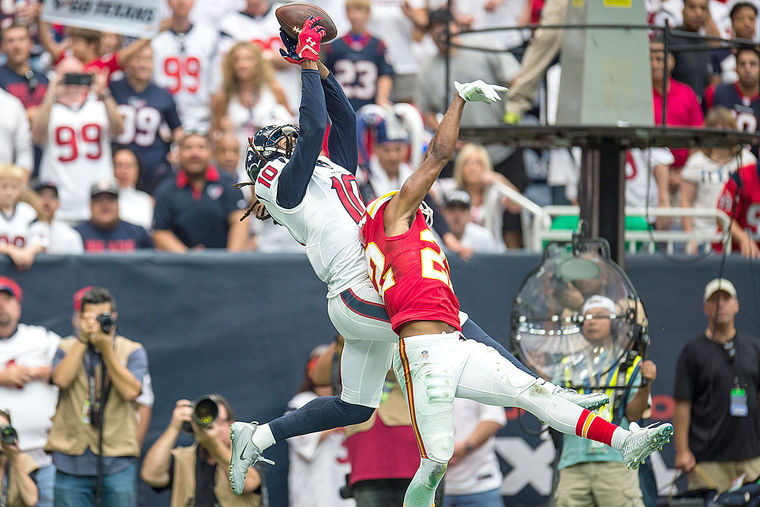
Injuries seem to be the keyword for the Houston Texans this week. As the team is coming off a loss to the Carolina Panthers they are awaiting news on whether or not wide receiver DeAndre Hopkins can pass concussion protocol. Watch as I discuss this issue as well as what…
-
Bullheaded – Episode 1
•
So I’ve decided to start a weekly video commentary on the Houston Texans, because Houston Texans!! So I will be going over the previous week’s matchup and topics surrounding the team then previewing the upcoming game by describing what the Texans need to do in order for a win to…
-
Texans Saved Their Future not Taking the Manning Trade
•
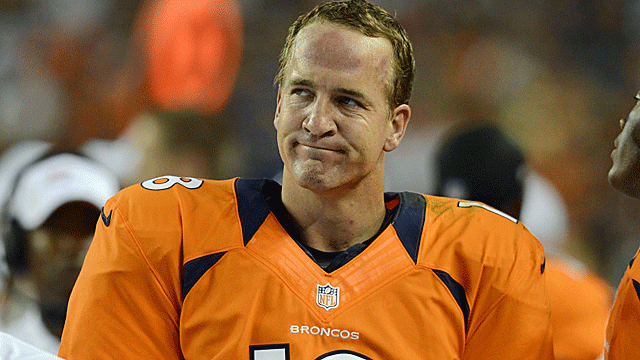
The Houston Texans almost damaged their future this offseason and you aint even know it. Wednesday, it was reported that the Denver Broncos were trying to work out a deal with the Texans to trade Broncos QB Peyton Manning. The news was first reported by Benjamin Allbright of 94.1 “fame” as he…
-

The Irony of the Oscars
•
A few weeks ago, the hashtag #Oscarssowhite dropped in response to this year’s major nominees not having any a representation of color. Many felt that the world’s greatest super villain, the white male, was once again flexing his super power of dominating mediocrity over a more worth diverse set of…
-

#IDFWU: Memorable Sports Breakups
•
Breaking up is hard to but very easy to arrive. Nobody can support that point more than today’s sports superstars. While these individuals earn millions of dollars on a regular basis, that money actually steers their personal and professional relationships to the end and sometimes to new beginnings. Look at…
-
Three Things I took Away from Selma
•
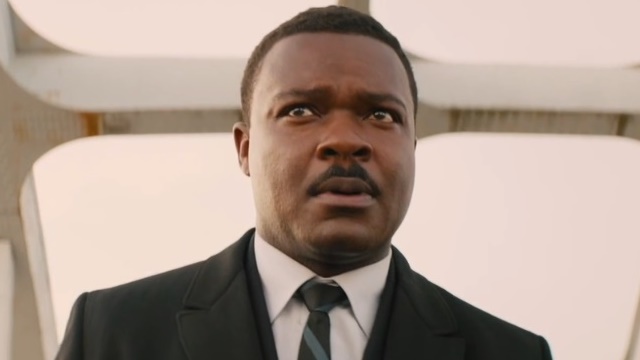
I just saw the movie Selma and it was all of the amazing that everybody believed it to be. The acting was great and the story was dope. Since its release, there have been a million reviews of the film and I will not become a million and one. However, I do…
-

This is Why Blackish Needs to Be Shown
•
After years of unsuccessful attempts since the early 2000’s, network television has finally decided to take on a black sitcom in ABC’s new show Blackish. The show focuses on Andre Johnson (played by Anthony Anderson), an African American senior vice president at an advertising company married to an interracial wife, Rainbow (played…